Wednesday, June 4, 2014

Fully integrated data and stanines into test curriculum (Michael and Jesse)

From our Wiki:
Both Jesse and Michael will work on finishing up the project and deployment. We will make sure that our work is fully compatible with the system we are working with and work out any last issues.
Deliverable: screenshots of the test curriculum and our role in it.

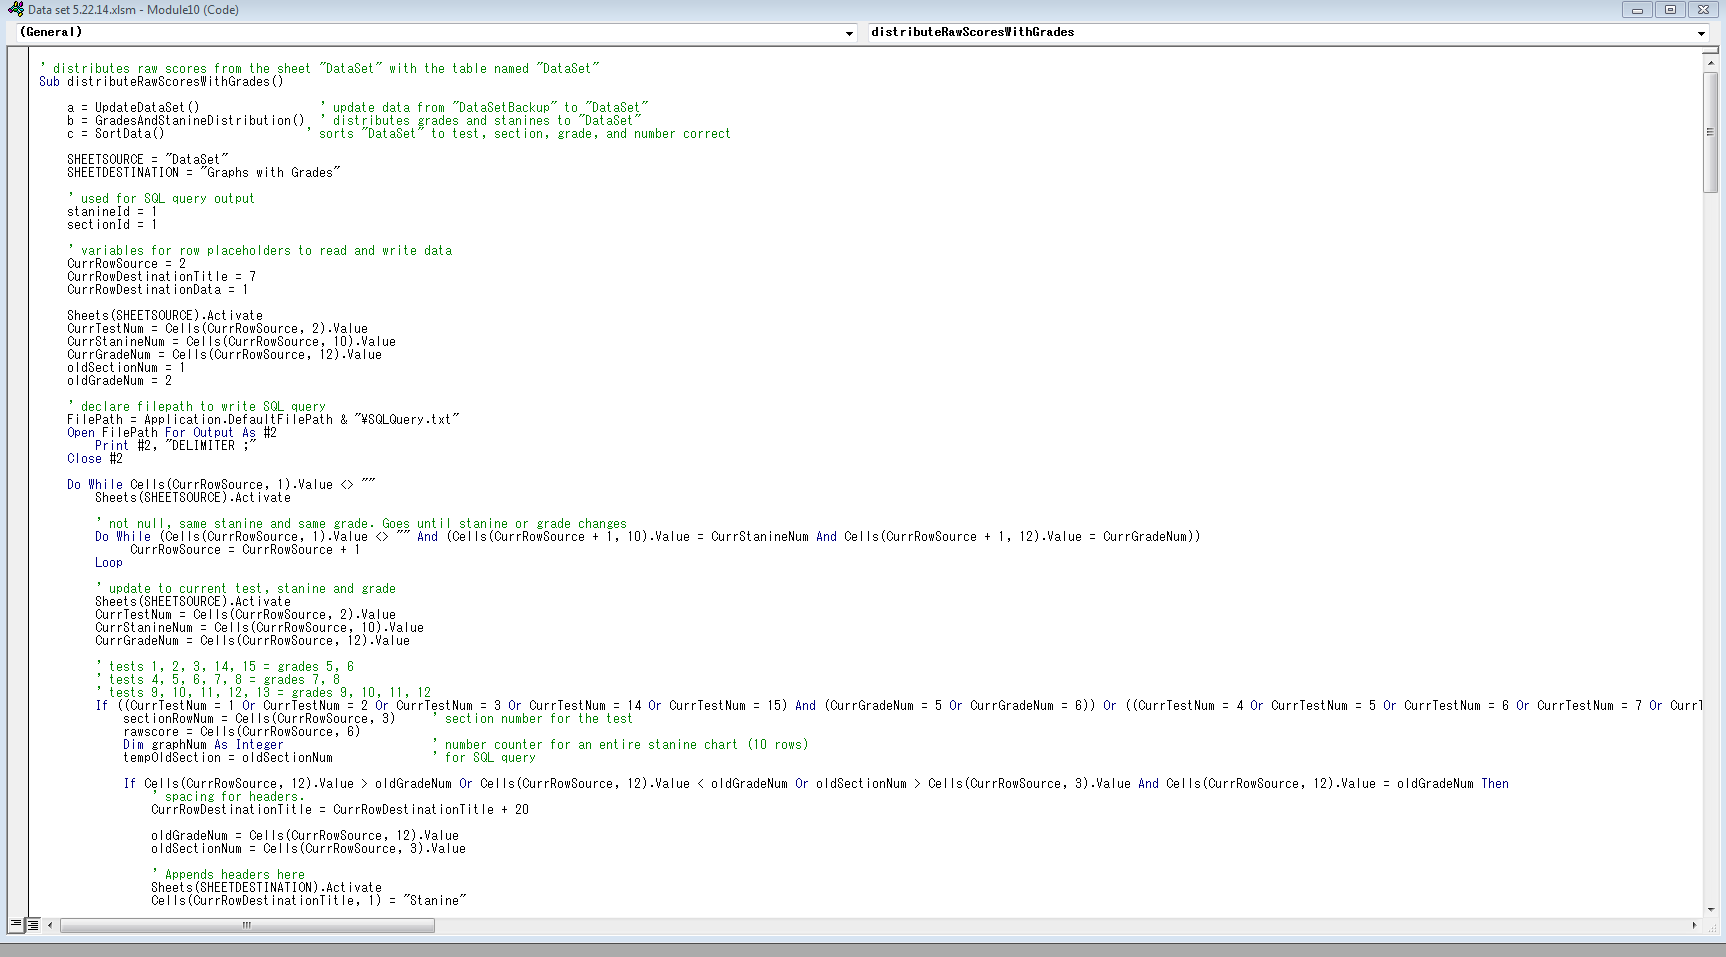
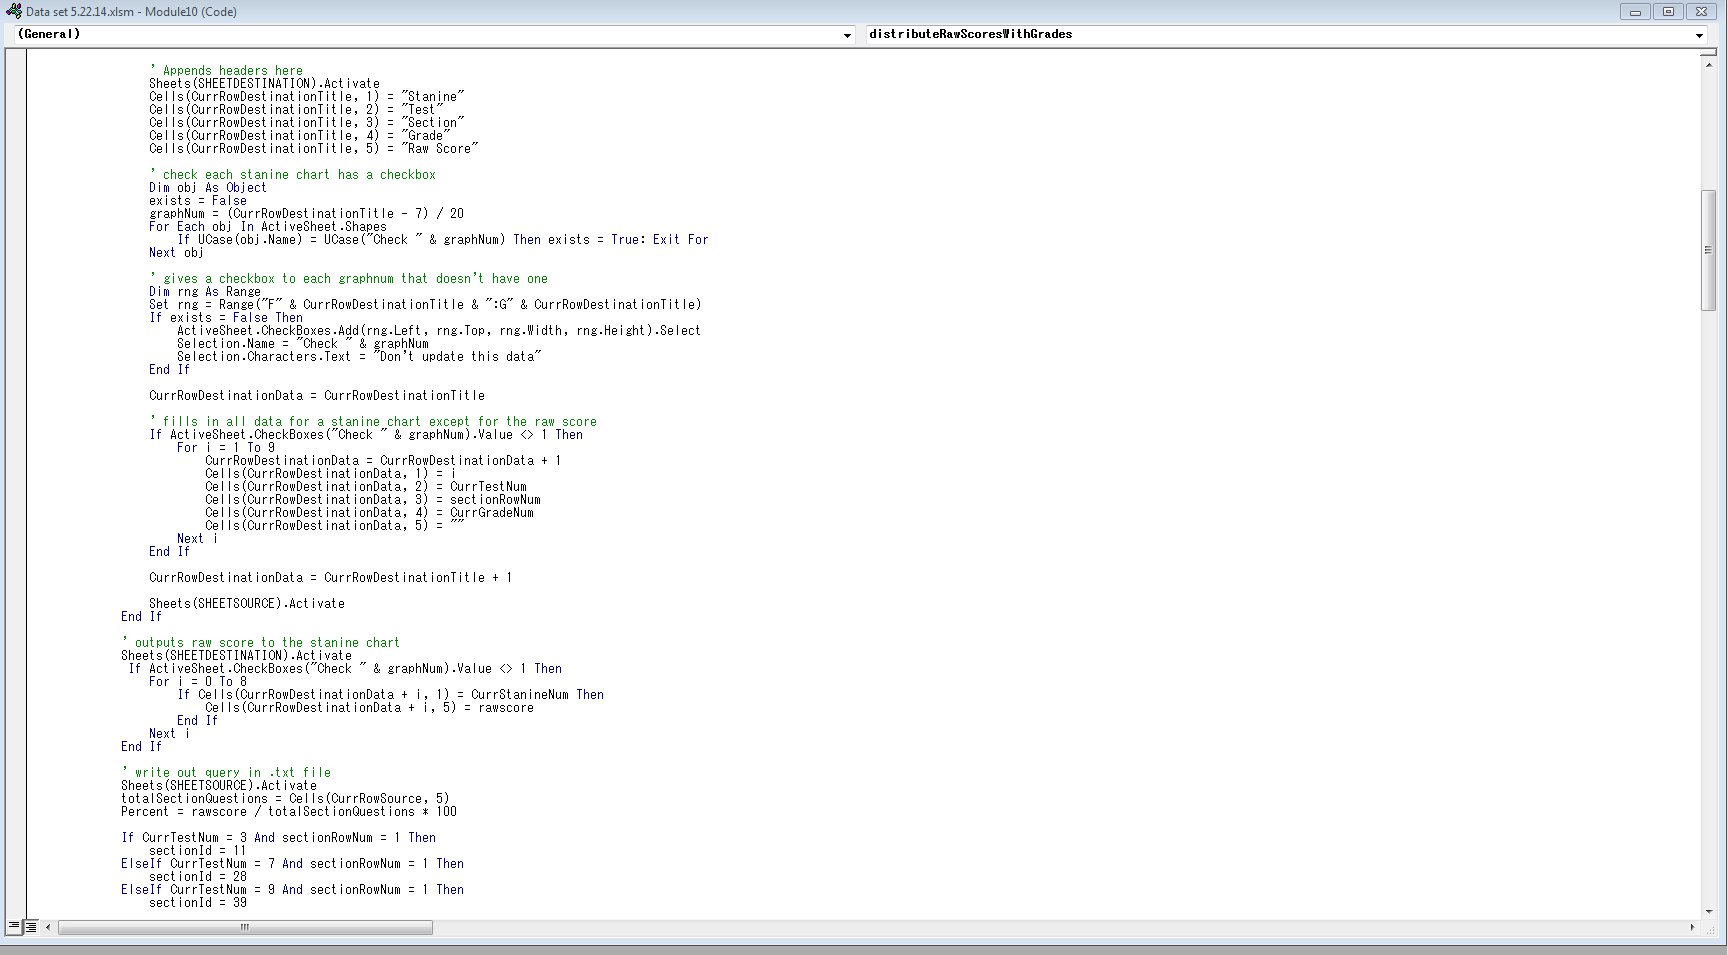
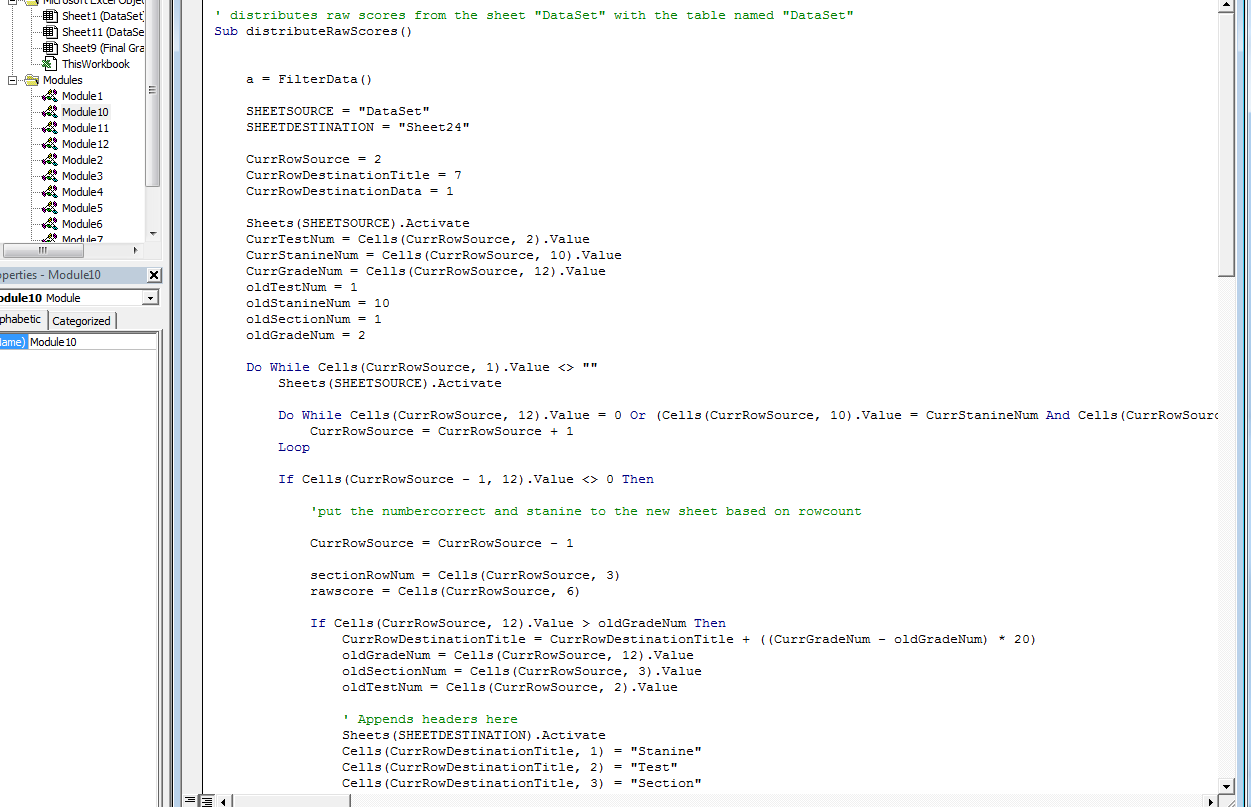
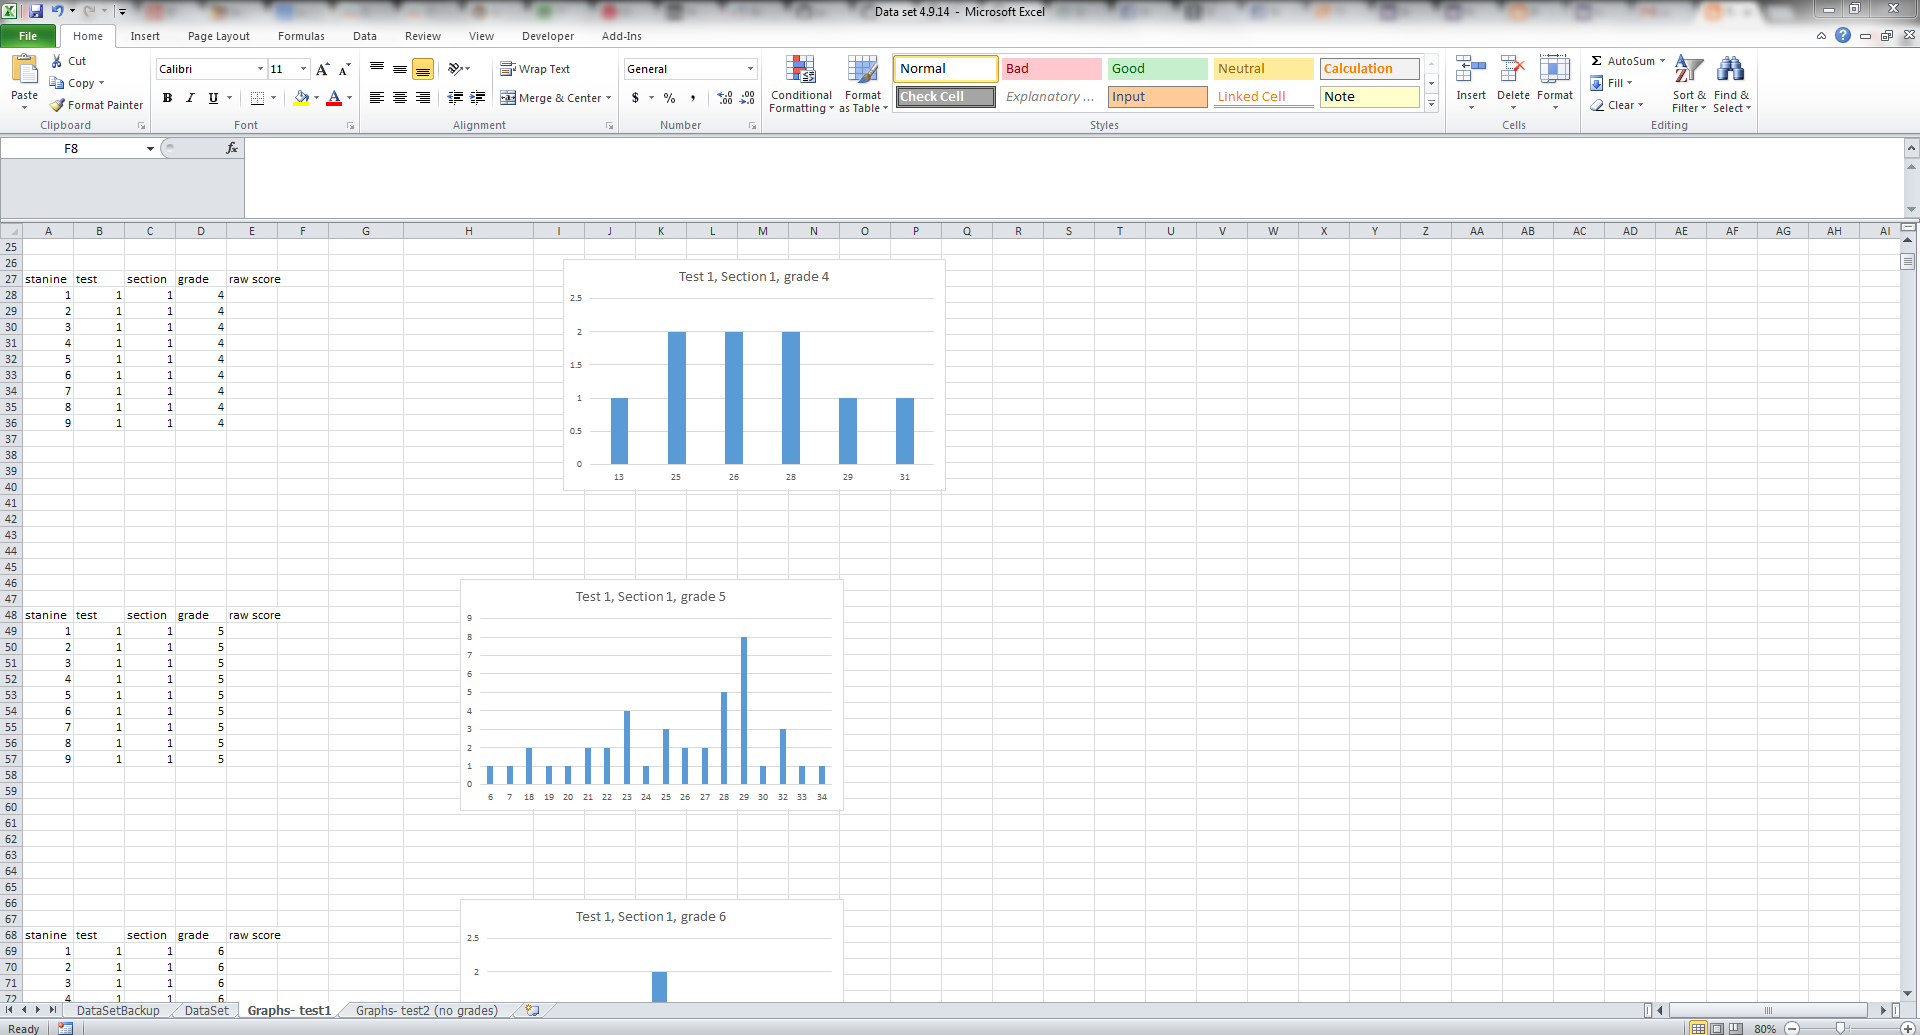
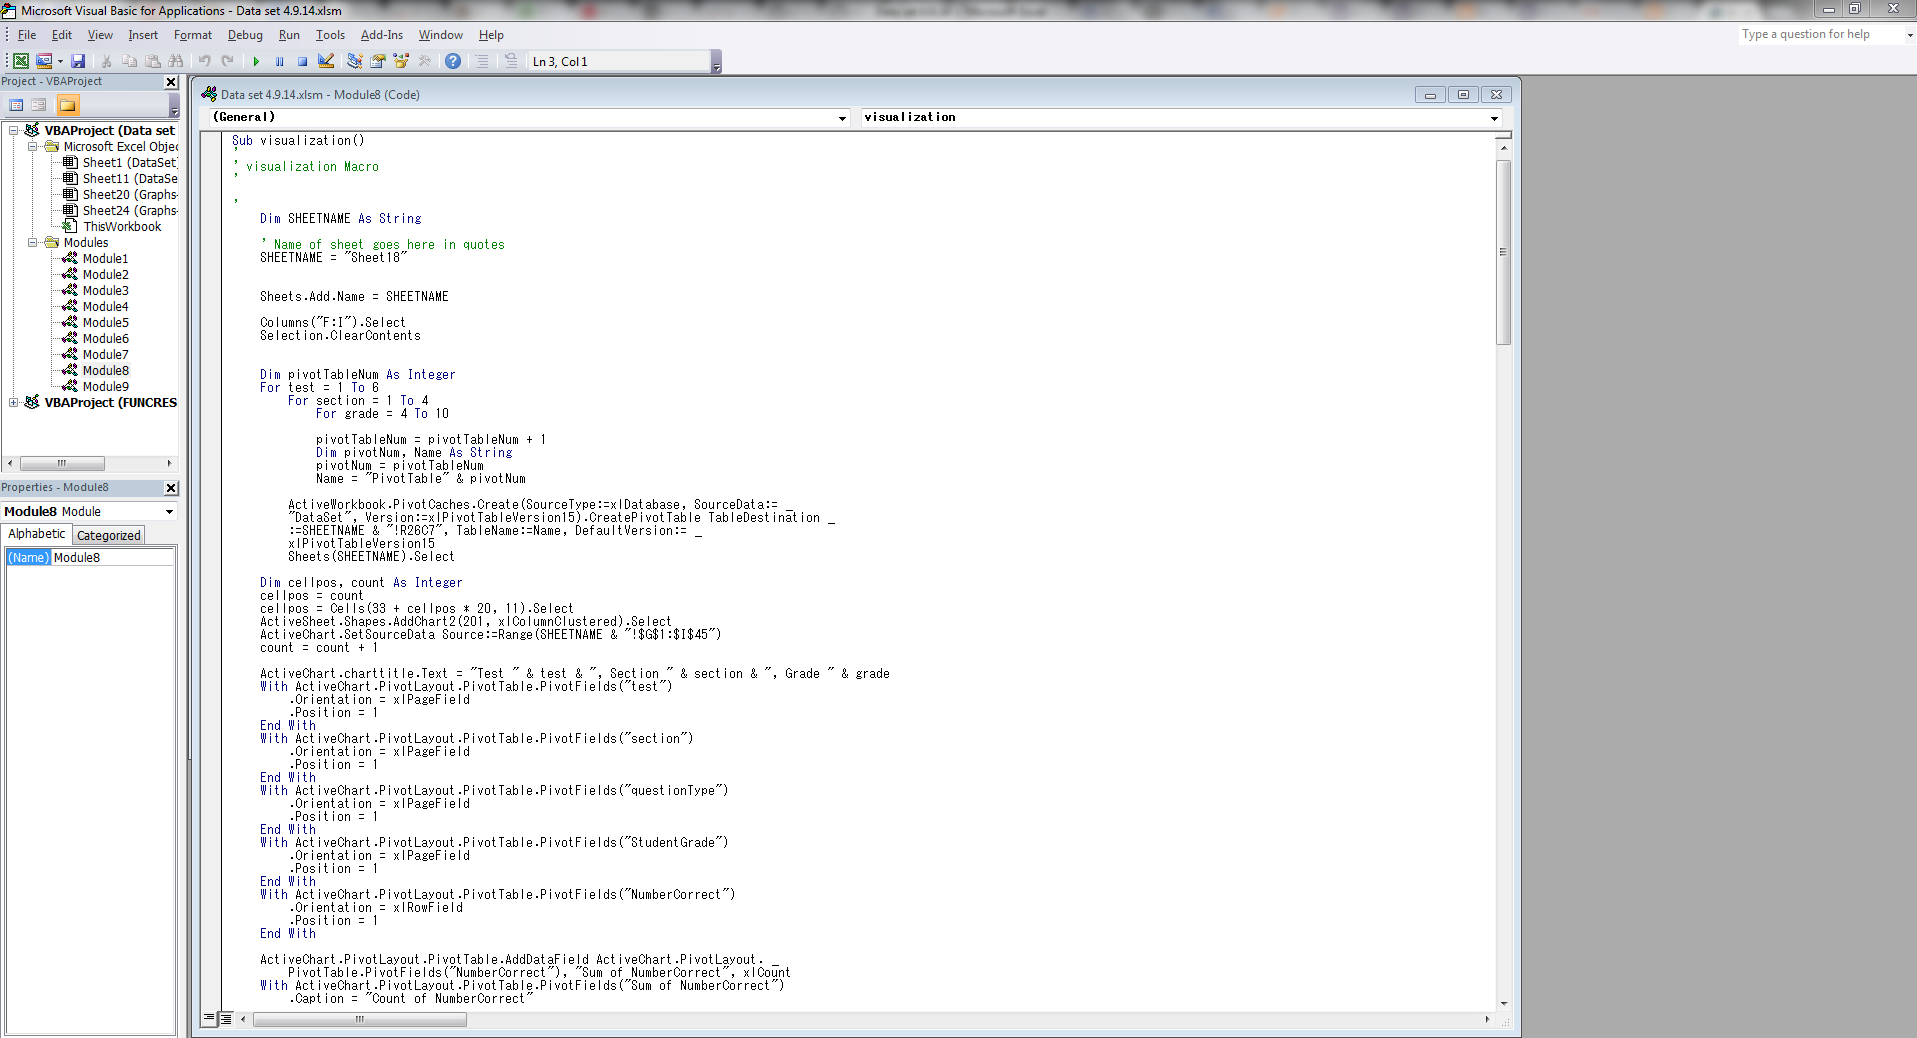
The goal of this deliverable was to wrap up and use it as a buffer to fix any issues that arose to make sure that what we had fully integrated into the system that our client had. We accomplished this by sending our work to him ahead of time to get his feedback. He was willing to help us by testing some of the functionality to make sure it was up to his expectations. As he did this and found a couple bugs or a miscommunication on an expectation, we fixed it. One example of this was the ability to update visualizations. What we had before was putting the visualizations on a separate location because of how long the runtime took. We thought it was best to leave the original visualizations and not overwrite them in case our client needed to interact with the data before the visualizations could finish. What we found out was that he instead wanted the visualizations updated on the same location which we were able to do by adjusting the code. This clarity and feedback is what this deliverable and additional time was for, fixing up issues that we had not foreseen. Since our client tested the system we gave him, he was completely satisfied with our results and made it the conclusion of our project.

Both Michael (10) and Jesse (10) worked equally on this deliverable. 

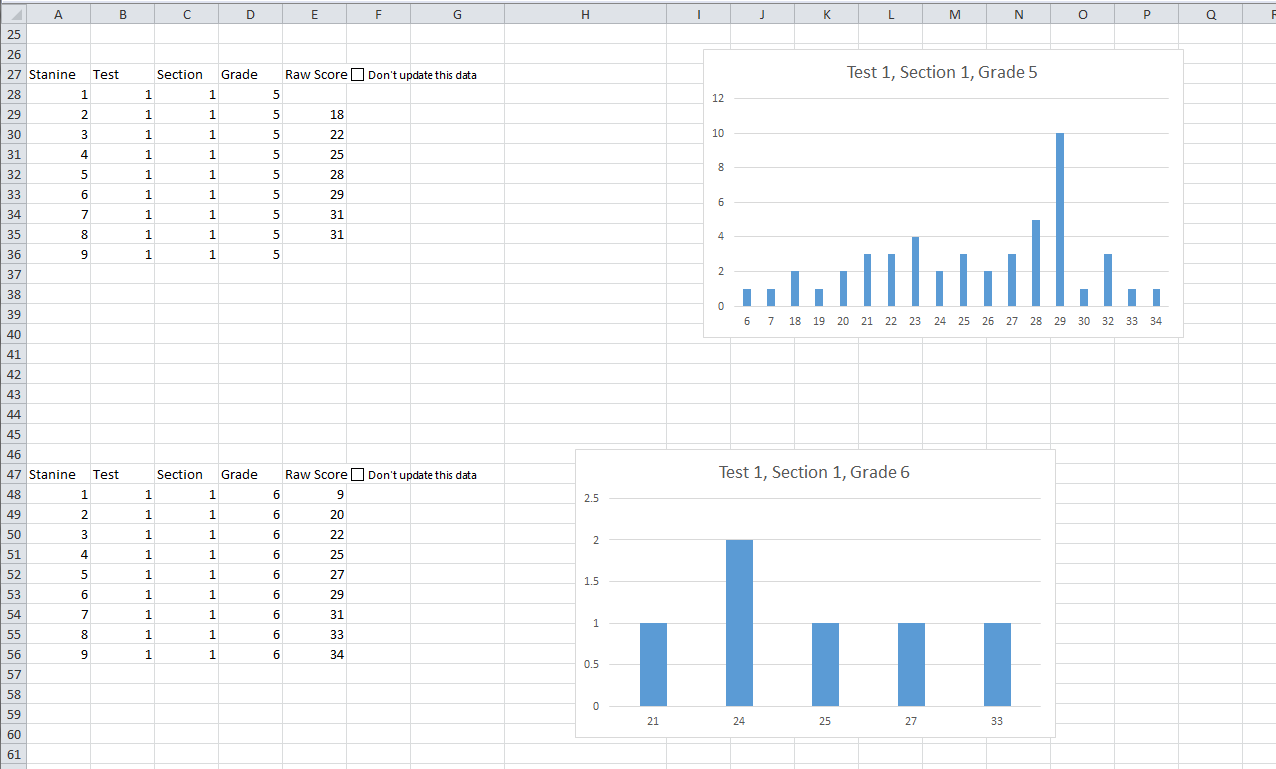
These next five images show what the site looks like. This is the dashboard we contributed to where the user sees their stanine scores, percentage in each section, and their raw score. There is a variety of other information for the user to browse through as well. 


Thursday, May 29, 2014

Success definition revision and measurements


  • Users of Test Innovators’ website and curriculum will have a predictable outcome when they take the actual ISEE test down to the exact stanine. This comes from a comparison of aggregated data from other students in the same grade level to accurately display the user’s stanine in relation to their competing students. This allows them to prepare accordingly.
o   Average scores of users of the site will be 10% better than average scores of the general population that didn’t use the site.
o   Users will be able to predict their stanine within one stanine number which will be collected through a questionnaire after they take the exam.
  • Users will have confidence that they prepared in an effective way by using the site. 
o   Users will be given a quick survey at the completion of their study curriculum on how confident they are to meet their goals with the ISEE. On a scale of 1 to 5, the average user will rate a 4 or higher.


The full site's curriculum has not yet been released. It will be released by Capstone night on June 5th. Our success definitions will provide us with a basis to measure our objectives but the issue with the current deadline is that there is not enough time. With these measurements, we will be collecting data after the student has completed the curriculum. The issue with this is that since the curriculum is only now being released, we need to wait until the students have fully completed it. This will take a couple months which will be far past the completion of this class. Our project is to help students take standardized tests more effectively. Since this is based on the users, we need user feedback. The most valuable feedback to test our success definitions is after the students have fully completed out curriculum which will take additional time. 

Monday, May 26, 2014

Debug Code and Ensure Accurate Automation

Jesse and Michael will work on fixing anything wrong with the code and make sure that automation is completely accurate. We will also write reports and document what we have done to make our work understandable and repeatable by our client.
Deliverable: screenshots of reports and code

The goal of this milestone was to finish debugging/cleaning our code and to ensure that the automation with our code completely satisfies our client's expectations and needs.

The first part of this milestone was utilizing the information that we received from our visualizations. In our earlier milestones, we created visualizations for every test by section and grade. This was done to give us a visual indicator of how much data we had for each of these tests by section and by grade. Through these visualizations, we noticed that we lacked enough data for many of the tests shown by the low populated/empty graphs when we break down the tests by section AND by grade. To give context, our client plans to use the data from the stanine tables to show how well each user is doing compared to their peers in the same grade on their website. The problem we face is that sometimes, there is not enough data to pull from.

To resolve this problem, our client requested that there be a "check-mark" by each stanine table. This check-mark can be toggled on to not update the data on the stanine tables or off to update the data automatically. This is shown in the figure below:
Stanine Tables with Check-mark

When the check-mark is checked, this will make it so that the macros we run to update the data will skip the specific stanine table to not update it. This allows our client to input their own data manually where there is not enough data yet. In doing this, our client can add data where is needed so that they can still provide information for users on their website about their performance relative to their peers. This was a completely new feature that our client requested and we had to perform several iterations in our code to get it working properly without bugs and to clean up the data.

The second major focus of this milestone was to further automate our code and make it scalable to be able to incorporate more tests. At the beginning of our project, our client only had 6 tests, 2 for each level: lower level, middle level and upper level ISEE exams. At this stage, our client has a total of 15 tests, 5 for each level. Due to this, we had to tweak our code to allow it to incorporate more tests and produce stanine tables and visualizations for the new tests. We managed to complete this over several iterations again of debugging and cleaning our code.

These are the screenshots showing some of the code for the added check-marks and incorporating new tests.

Code Screenshot 1
Code Screenshot 2
Jesse (10) and Michael(10)  both worked equally on this milestone. Our next steps will be our final milestone. This milestone will be finalizing our project with our client and making sure our code will be fully integrated, with all the requirements of our client. In addition, we hope to make our code and system scalable and fully automated. This will be shown in the most updated website.

Friday, May 9, 2014

Setup integration of Stanines (Michael and Jesse)

The goal of this milestone was to lay the foundation for a user to find their stanine based on their score, grade level and test that they took. What we have done so far was only locally on our machines in an excel file. Even if we sent this excel file to our client he wouldn't have a way to put it into his database. By putting this information into the database the web developers will be able to give the students their stanines.

The route we took in this milestone was to create SQL queries for our client to put into his database which will populate his tables. By having the tables correctly populated, the developers will be able to read that data from the database and relay the relevant information to the student. One step further, the reason the student would want this stanine information is to get an understanding of how they are doing in relation to their peers, what they can expect their test scores would be in a real life scenario, and to boost their confidence when they do take the real test. These stanines are also valuable for our client because having this information keeps him competitive and helps the company stand out from competitors.

The way we accomplished this milestone was through writing VBA in Excel to output all the queries into a text file. As a side note, the reason we output the queries for our client to put into his database instead of connecting the excel file directly to the database is security reasons. They don't want an extra port being used for this because it is an extra vulnerability that they would need to secure.

We wrote code that builds off displaying the stanines which you can see from the previous milestone. The code gets all the relevant information and outputs SQL queries into a .txt file. Our client can then use those queries to populate his database. The queries are robust enough where they create new rows if there is brand new information that was not seen before or it will update rows if they already exist and need to be updated.

We set up our own database with a table that is exactly like our clients for testing. We got the correct output, put it in a .txt file, then populated our database. It worked on our test database and after confirmation with our client it worked for him as well.

Jesse(10) and Michael(10) both worked equally on this project. Our next steps will be ensuring our code has absolutely no bugs with testing. The automation process needs to be completely accurate. We will also document our work so far so others can understand and replicate our work if it needs to be.

VBA Code 1

VBA Code 2

SQL Queries in .txt file

Queries in the database populating the table


Friday, April 25, 2014

Development of Stanines (Michael and Jesse)

This milestone is the second part of our code for the automation of our work. Our client wants all of our work up to this point to be robust and completely automated. This means that all he has to do is add in new data (copy and paste from his SQL database) into the excel document and hit "refresh all" and the stanine tables and visualizations will be automatically updated with the new data.

To achieve this, we were able to make a macro in Excel that automatically parses through the data and outputs stanine tables across each section of each test by grade level. Some of these groups have little to no data and is shown by the empty/less filled tables. 2 of the screenshots below show some examples of the stanine tables.

In our last milestone, the stanine tables did not fill out the raw scores yet and were not automated. We had to manually create them. This time, all the stanine charts are automatically outputted for each grade by test and section. (Our client wants it by grade by test and section because that is what they will use in their system to display results to the users. The end goal is for users to have feedback regarding where their test scores from diagnostic tests stand in relation to other people in their grades on each of the tests and sections.)

The end goal of this deliverable is for our client to connect our Excel file into their back-end SQL database to be used in their website. The end goal is to read off the data from the Excel file and feed it into the results page for users taking diagnostic tests in the future.

Michael and Jesse worked together on this milestone. Both of us will work together on the next milestone again.

Screenshots:
Stanine Tables 1

Stanine Tables 2
Note: there are much more stanine tables than can be possibly shown. Grades 3-11 have a stanine table each broken up by test and section (there are 6 tests total and 4 sections for each test).

Macro Code 1

Macro Code 2
Note: this is all the code that deals with actually outputting the stanine tables. The code for setting up the correct filters is not shown.

Thursday, April 10, 2014

Automation of Visualizations (Michael and Jesse)

This milestone we needed to redo some of our work. After meeting with our client, we realized that we needed to understand the data better before we moved forward. Some new visualizations needed to be created to correctly evaluate the data set. That would give a quick and easy way to see the validity and quantity of the data. This milestone makes visualizations based on data that is sorted by test, section and grade.

After talking to our client, we set up a meeting with him and one of his developers who offered to help us. We asked if there was an easy way of creating visualizations that was automated with excel but he didn't know of any methods we didn't already know so we continued to write everything with macros in Excel.

The conclusion we came to is that there is not enough data right now. We then altered the code to exclude grades and only look at test and section to try to do less filtering to get more data per graph. This helped but there should still be a lot more data to be effective. As time goes on and data accumulates, the graphs will be more informative in different ways. One example would be the distribution of scores for a particular test and section.

Jesse and Michael worked equally on the code to get the visualizations to be automated.

Automated Visualizations


Macro for Visualizations

Our goal is to fill in the Stanines


Thursday, March 20, 2014

Milestone 6 - Improvements Implemented

After meeting with our client and presenting our work, our client requested that we also calculate stanine scores by different sections (questionType). We have edited our code to account for questionType instead of just "TestOverall" Here is a link to our code: 

http://gyazo.com/8d85ef3e7c9fbca2eea15562a9a9a7d3

This code will go through the entire data set by different questionTypes and count up how many pieces of data we have for each. With this count, we calculate the stanine score of each user and apply it across all of the data set.

This draws us closer towards feeding data into the back-end of the website/diagnostic test and displaying the appropriate stanine scores for each section for users.

Thursday, March 13, 2014

Milestone 5- Improved Diagnostic

This file will produce the information used in the diagnostic test.

https://www.dropbox.com/s/gwyd1tejb632qwg/Data%20set%20with%20TestOverall%203.11.14.xlsm

What we have been spending most of our time on is the automation of the numbers going into the diagnostic tests that was explained in the previous Milestone. You are able to add or delete rows of data and the Macro will still handle this and produce the correct Stanine numbers.

This file accomplishes three things right now:

1) Fill in the correct grades for each UserId
2) Create a "TestOverall" row that accumulates all "Overall" test rows and creates a single test score
3) Calculate the Stanine for each test

These options are fully automated by using Macros. The specific Macro is "Module1.filters". You are able to view the code along with the comments explaining the code. There is also a visualization on the last tab that could be used on the dashboard.


Our next steps will be to include the accurate Stanines to specific sections such as Algebra or Reading Comprehension. This will be done by comparing students in the same grade level who took the same test. We also need to correctly filter out the users that have omitted too many questions because we have determined that it is not valid data and shouldn't be included to calculate the Stanines.

One problem we had that needs to be corrected is a rounding issue for administering the Stanines. This is a small bug in our code that will be fixed by the next milestone. Without getting into too much technical detail, the result of the bug is that there will either be a slight overflow or shortfall of Stanine numbers given in relation to the number of actual tests.

Thursday, March 6, 2014

Milestone 4 - Diagnostic Design Approval

Here is the screenshot of the diagnostic test mock-up:
https://www.dropbox.com/s/1yzlgc1eqnkoq9b/Diagnostic%20Test%20Screenshot.png

Currently, Michael and I are in the process of collaborating with our client with integrating our graphs and Stanine overlays with the diagnostic test that is in development. If you look at the mock-up, our work will fill out the Stanine chart at the top and our graphs will be used for the analysis section. This is just an initial mock-up and there will be more iterations where improvements will be implemented.

For clarification, so far, Michael and I have been working entirely together on all of the milestones thus far. Although, there have been rare occasions where we divide up the tasks and work remotely.

Tuesday, February 25, 2014

Milestone 3 - Client Presentation

Here is the PowerPoint that we used in our presentation with our client:

https://www.dropbox.com/s/0c214qr3bdvy0j8/Client%20Presentation.pdf

Friday, February 21, 2014

Milestone 2 - Analyze, Clean-Up and Visualize Excel Data

Below are the screenshots of our data:

Original data set: http://gyazo.com/c01a1d864f7b773582d949540815f2a7

First iteration:
http://gyazo.com/a681a0df4eb070acfced98e5b4eeecd2
http://gyazo.com/51781fe39062f343db1eb6ae6063b56f
http://gyazo.com/aa7e152e6ffb31bddc254ebea804949a
http://gyazo.com/2c835c7b218671d5e1e174ce3b88d380
http://gyazo.com/f899545fe3fa5face5fe59fb90fb7535

Second iteration:
some macro coding to clean up data: http://gyazo.com/e83706488701f1278700f2abc21ab6d7
http://gyazo.com/2ab9d02e041fe931e1d4ef97c3f31ed9
http://gyazo.com/a15ab73a1ddd071a233716bb41d73d59
http://gyazo.com/d87aebc5737c362f3ac7a41e747fde7a
http://gyazo.com/e062fb5f03ab73f4a1951037c7c66a03
http://gyazo.com/6750408147865d4a2bdcde5b26fda7b7
http://gyazo.com/9b470dca5d183cc090636b62da54d5f7

Third iteration:
http://gyazo.com/7ebc3c62949213ae075e56233228c7de
http://gyazo.com/b6ea800a181df6803f6bcf6807a63be6
http://gyazo.com/ac44cf4fb26242bf26953b07718c7d50
http://gyazo.com/b38b8a072cc977f735703176f08ab7a4
http://gyazo.com/8b306557efecef08af0a7d3ed3c2b1b4
http://gyazo.com/fb614853f000954ea85b41f5cb6092ca
http://gyazo.com/1393ab3dbfe18d4936fece4e526f7142
http://gyazo.com/8c3dbf17158aa21a328b09a5e0b639d4

Fourth iteration:
http://gyazo.com/58933206ab8538ec8c9fe1454e2d30ae
http://gyazo.com/2a979beb000274490173aa29ca0f9ca0
http://gyazo.com/29dffdee33100970b2ad8829e56fa152
http://gyazo.com/1f9a5233a71a7efedbfe94f3c40b5d21
http://gyazo.com/dcbe94a19b0d708b3f5d2937007b0f88
http://gyazo.com/2ed596064008ccd866ecfe9d6e8370f5
http://gyazo.com/8d2449c344b571dcc1038771207e61f0
http://gyazo.com/f32619dc3411b11725d69ee222567e17


Wednesday, February 19, 2014

Milestone 1 - Research: ISEE, Industry/Market Space

ISEE: Independent School Entrance Exam

  • Exam kids take for entrance into private schools
  • 3 Levels:
    • Lower, middle, upper
      • Lower: grades 4 & 5 trying to get into grades 5 & 6
      • Middle: grades 6 & 7 trying to get into grades 7 & 8
      • Upper: grades 8-12 trying to get into grades 9-12
  • ISEE consists of 3 parts:
    • Verbal and quantitative reasoning tests
      • measure capability for learning
    • Reading comprehension and math
    • Essay
      • Not scored, sent to requested schools
  • Can only take test once within 6-month period.
    • If taken a 2nd time, results cannot be reported
  • Provides:
    • "Standard assessment of each application's skills and a ranking of abilities and achievement against peers"
    • "Standards aligned with the National Council of Teachers of English (NCTE), the International Reading Association (IRA), and the National Council of Teachers of Mathematics (NCTM)"
    • "Confirmation from statisticians that each item is relevant, content, specific, and suited providing the most accurate assessments"

Industry/Market Space:

Barron's:
http://barronstestprep.com/

  • Offers prep for: GRE, GMAT, SAT, ACT, PSAT but not ISEE
  • One of the leaders in standardized test preps
  • Personalized/Customized curriculum for individual students
  • Online programs
  • Access to experts, teachers, etc
  • Diagnostic test
  • Personalized Profiles/Dashboards
  • Access to Lessons from experts
  • Step-by-Step Video solutions
  • Test Prep Reports
  • Practice Tests:
    • Video Lessons
    • Video Solutions
    • Lessons
    • Full Length Tests
    • Online Practice
    • Diagnostic Test
    • Thousands of practice questions
Kaplan:
http://www.kaplan.com/


  • Has essentially all standardized tests:
    • Graduate Admissions:
      • LSAT
      • MCAT
      • GMAT
      • GRE
      • MAT
      • DAT
      • PCAT
      • OAT
    • Medical Licensing:
    • Nursing
    • College Admissions:
      • PSAT/NMSQT
      • SAT
      • ACT
      • SAT Subject Tests
      • AP Exams
      • ASVAB
      • Guidance Counselor
    • Bar Review
    • Grades K-8:
      • SHSAT
      • SSAT
      • ISEE
      • Academic Tutoring
    • GED
    • Much More
  • For ISEE:
    • Only offer private tutoring
    • Call 1800-KAP-TEST
As of now, the market space for ISEE test prep is pretty open. As far as our research shows, there are currently no companies that offer online help/test prep for the ISEE. This gives Test Innovators a lot of leverage because they essentially found a niche in the market and are the first to do what they are doing (offer practice tests and test prep).

Even so, we have researched Barron's and Kaplan to analyze the practices they use for other standardized tests to help understand their business model and what has been successful for them to help shape the vision of Test Innovators.