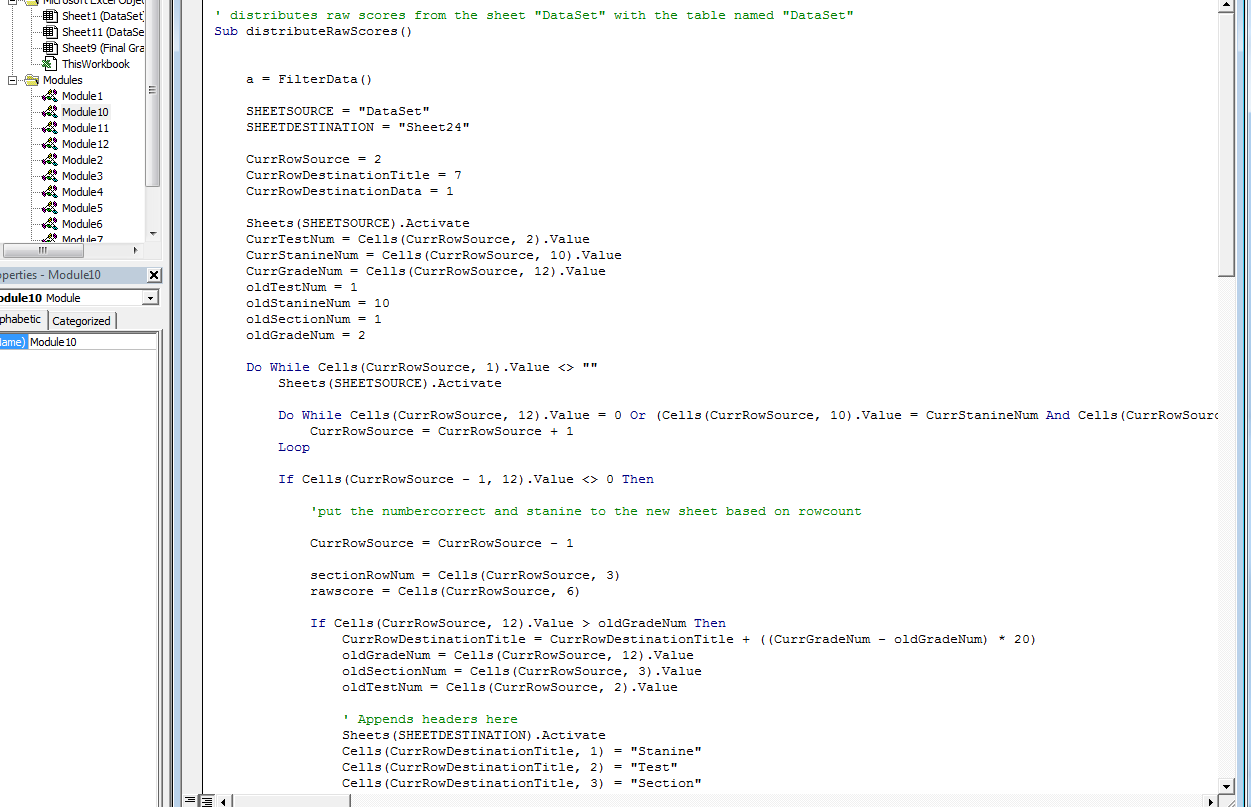
To achieve this, we were able to make a macro in Excel that automatically parses through the data and outputs stanine tables across each section of each test by grade level. Some of these groups have little to no data and is shown by the empty/less filled tables. 2 of the screenshots below show some examples of the stanine tables.
In our last milestone, the stanine tables did not fill out the raw scores yet and were not automated. We had to manually create them. This time, all the stanine charts are automatically outputted for each grade by test and section. (Our client wants it by grade by test and section because that is what they will use in their system to display results to the users. The end goal is for users to have feedback regarding where their test scores from diagnostic tests stand in relation to other people in their grades on each of the tests and sections.)
The end goal of this deliverable is for our client to connect our Excel file into their back-end SQL database to be used in their website. The end goal is to read off the data from the Excel file and feed it into the results page for users taking diagnostic tests in the future.
Michael and Jesse worked together on this milestone. Both of us will work together on the next milestone again.
Screenshots:
 |
| Stanine Tables 1 |
 |
| Stanine Tables 2 |
 |
| Macro Code 1 |
 |
| Macro Code 2 |
No comments:
Post a Comment