After talking to our client, we set up a meeting with him and one of his developers who offered to help us. We asked if there was an easy way of creating visualizations that was automated with excel but he didn't know of any methods we didn't already know so we continued to write everything with macros in Excel.
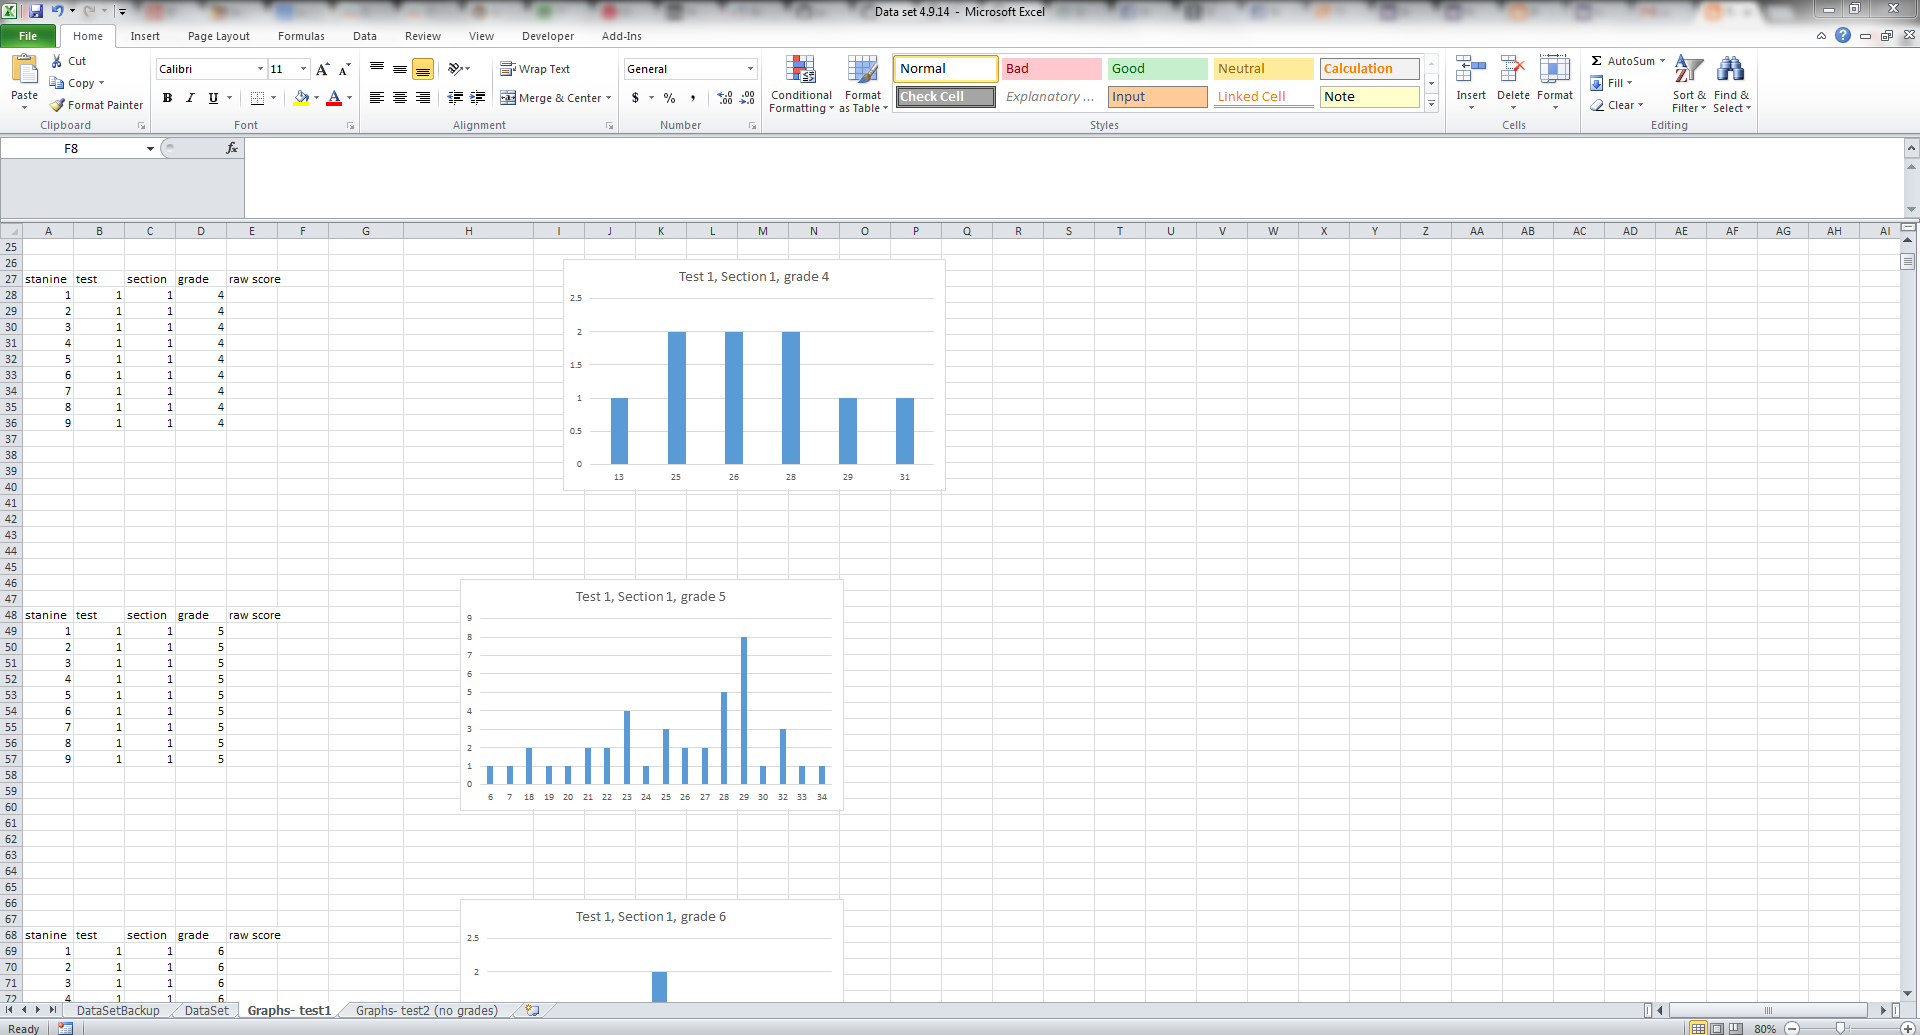
The conclusion we came to is that there is not enough data right now. We then altered the code to exclude grades and only look at test and section to try to do less filtering to get more data per graph. This helped but there should still be a lot more data to be effective. As time goes on and data accumulates, the graphs will be more informative in different ways. One example would be the distribution of scores for a particular test and section.
Jesse and Michael worked equally on the code to get the visualizations to be automated.
 |
| Automated Visualizations |
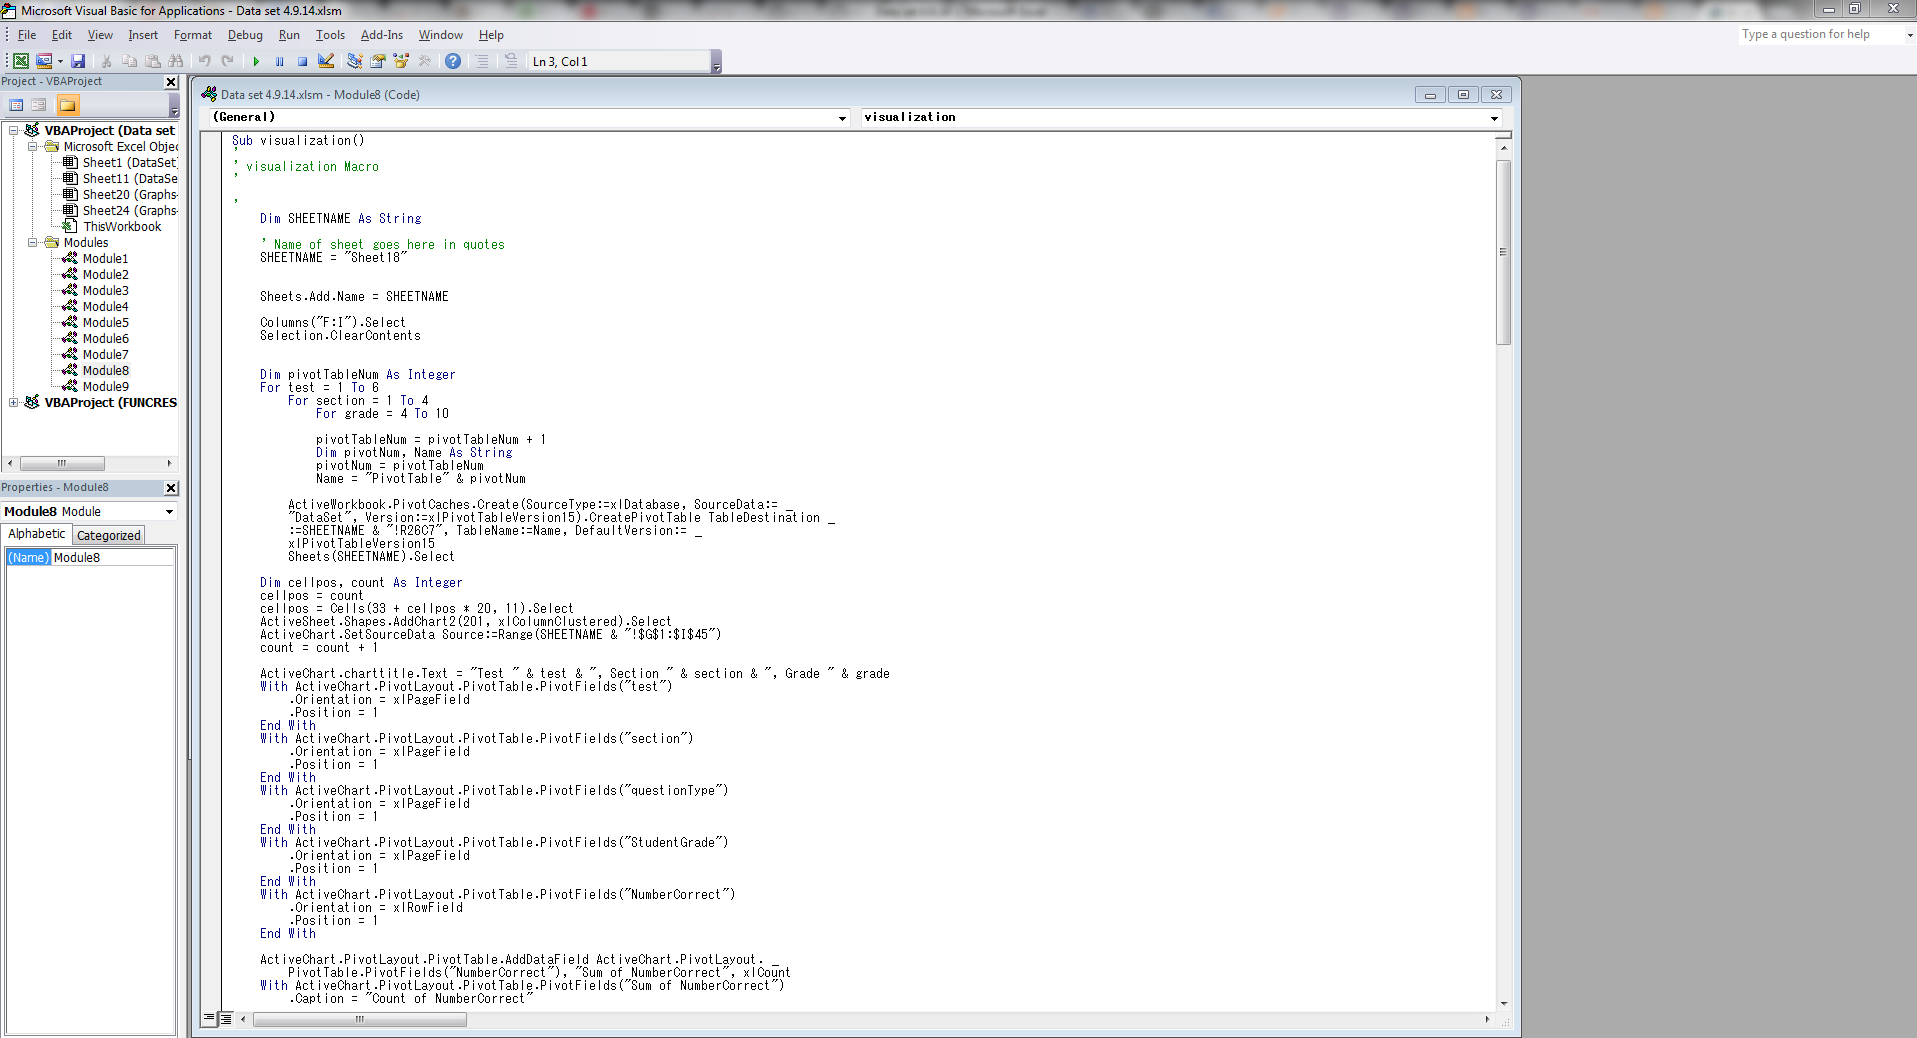 |
| Macro for Visualizations |
 |
| Our goal is to fill in the Stanines |
No comments:
Post a Comment