Friday, April 25, 2014

Development of Stanines (Michael and Jesse)

This milestone is the second part of our code for the automation of our work. Our client wants all of our work up to this point to be robust and completely automated. This means that all he has to do is add in new data (copy and paste from his SQL database) into the excel document and hit "refresh all" and the stanine tables and visualizations will be automatically updated with the new data.

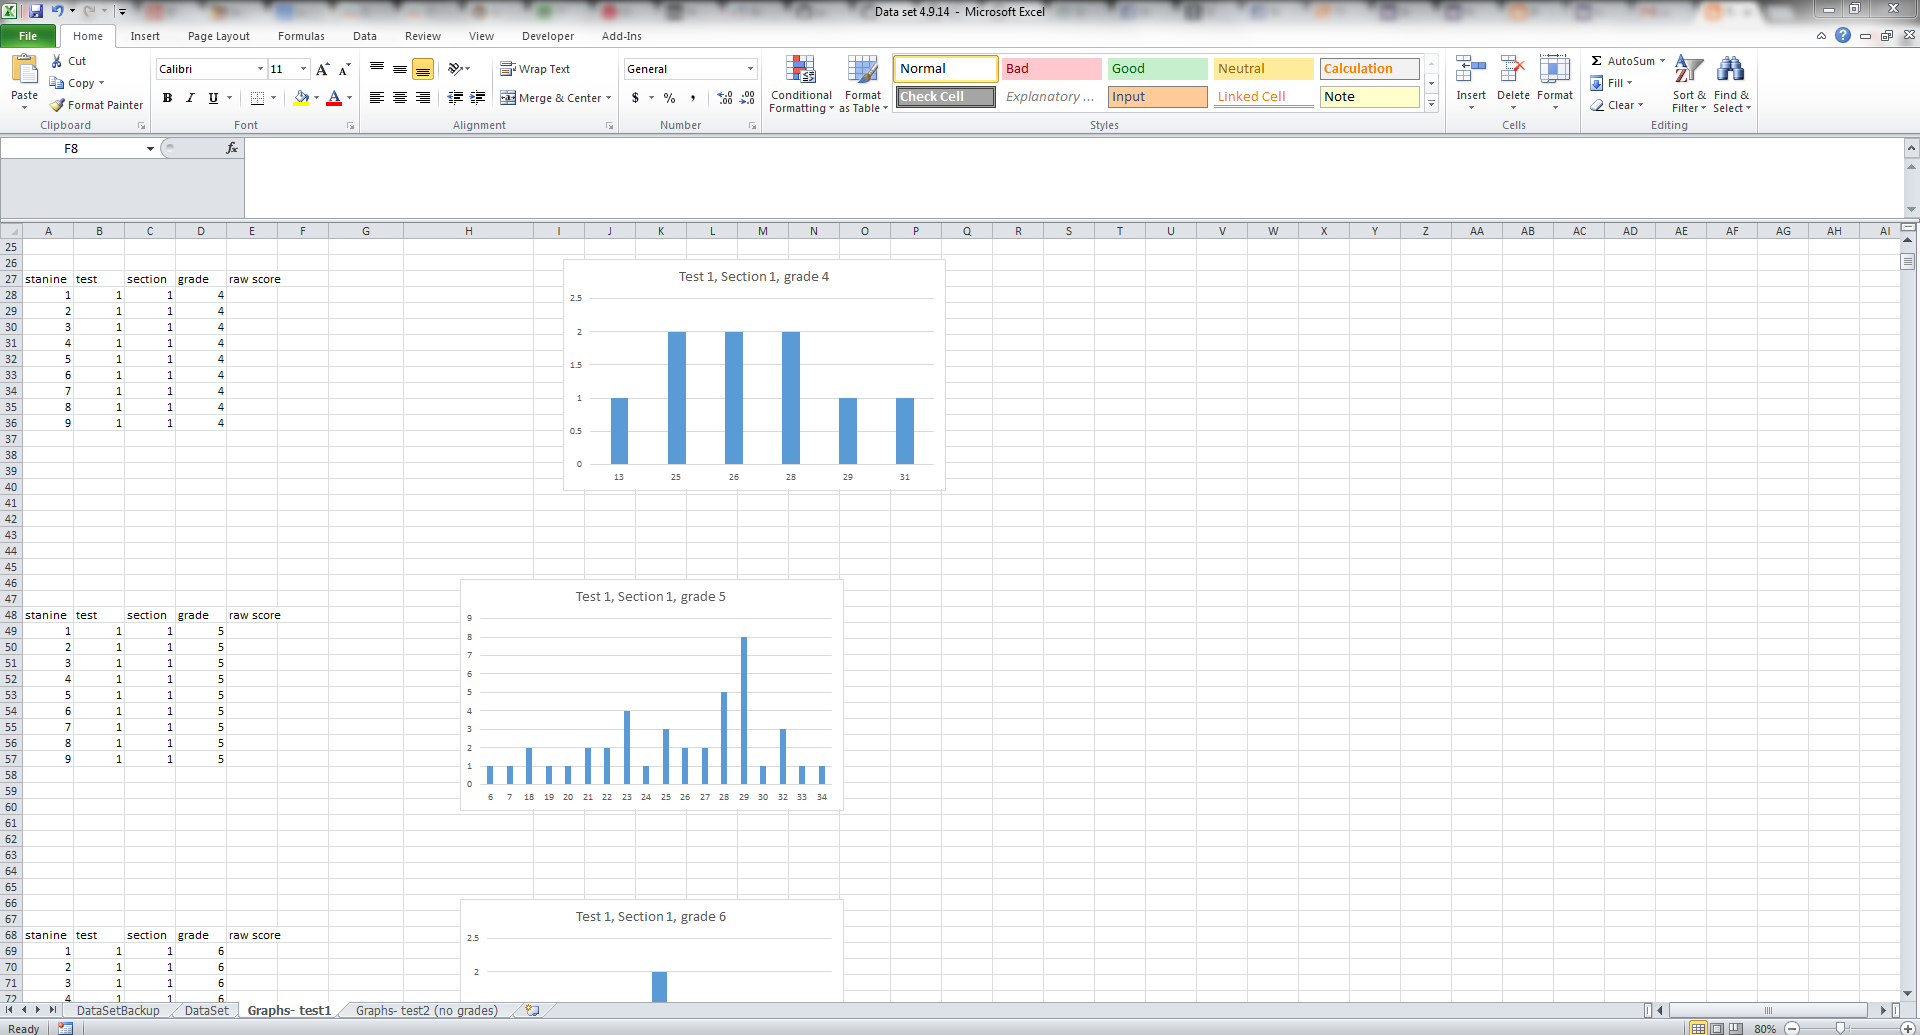
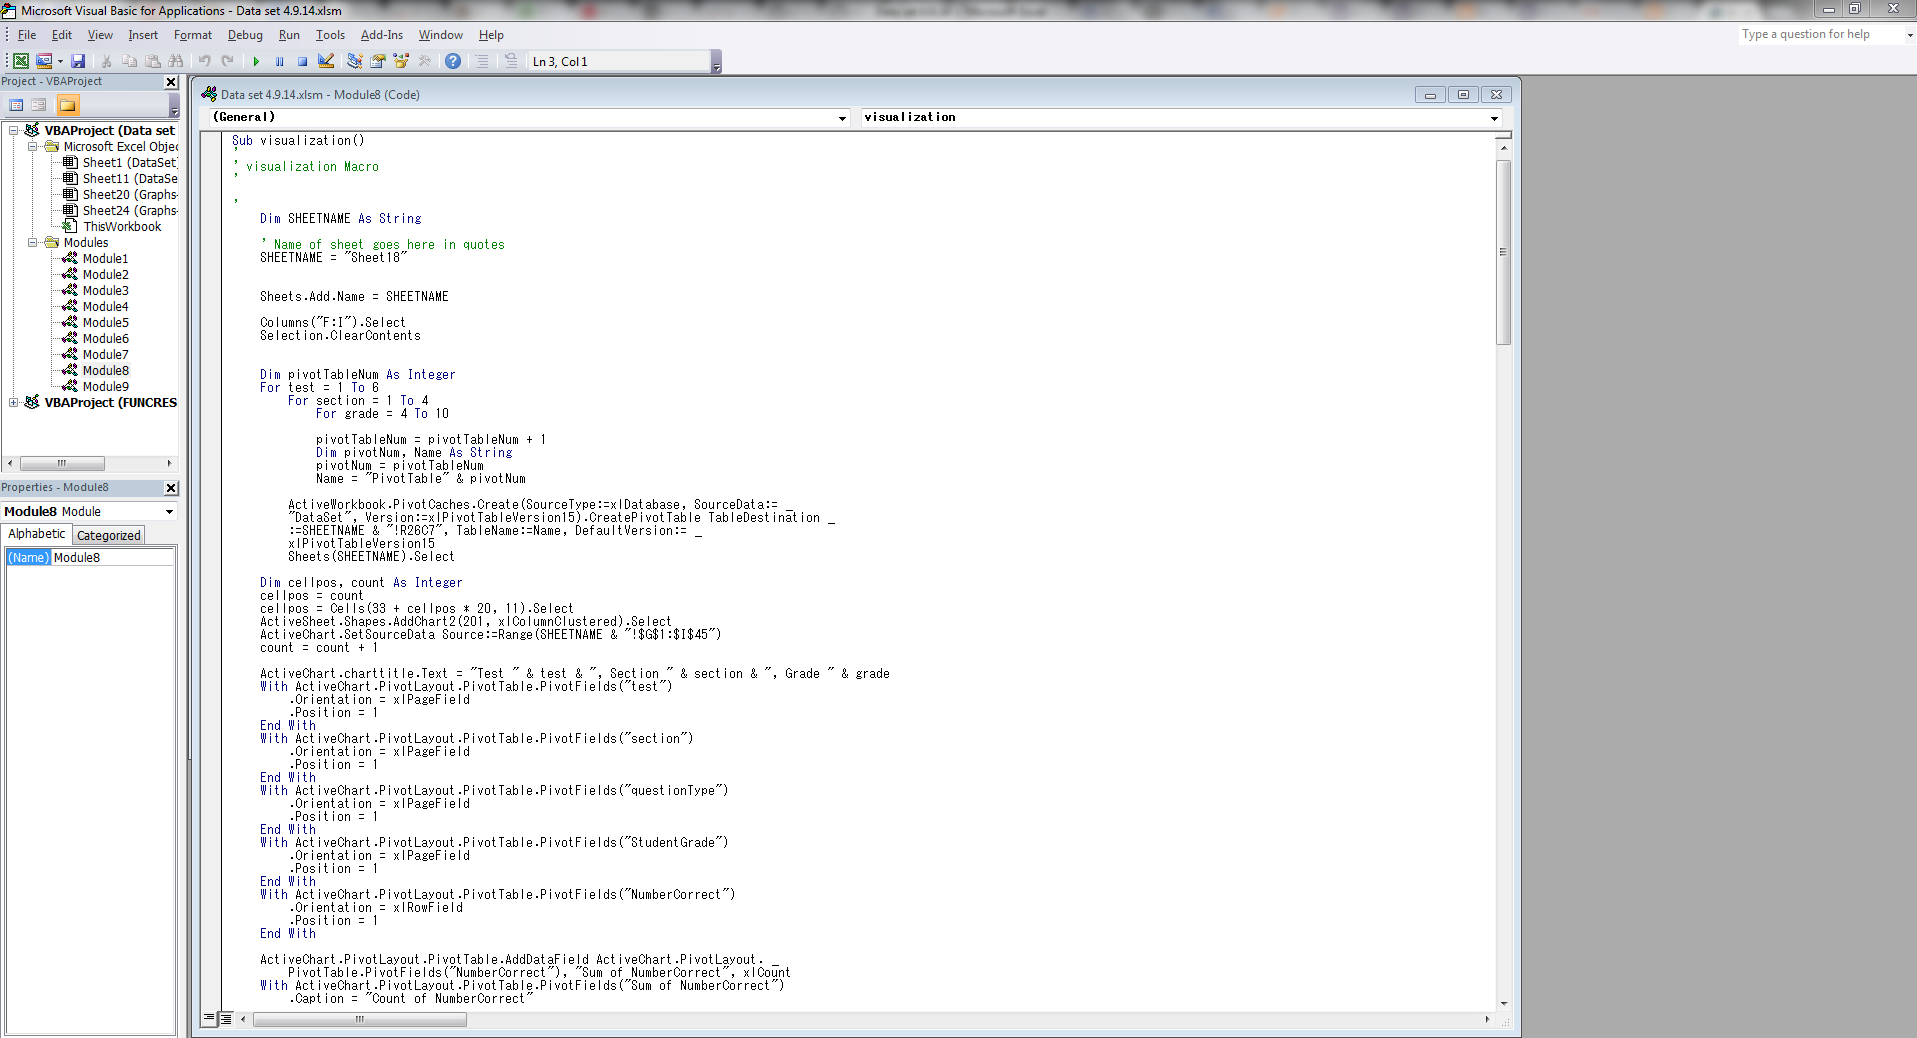
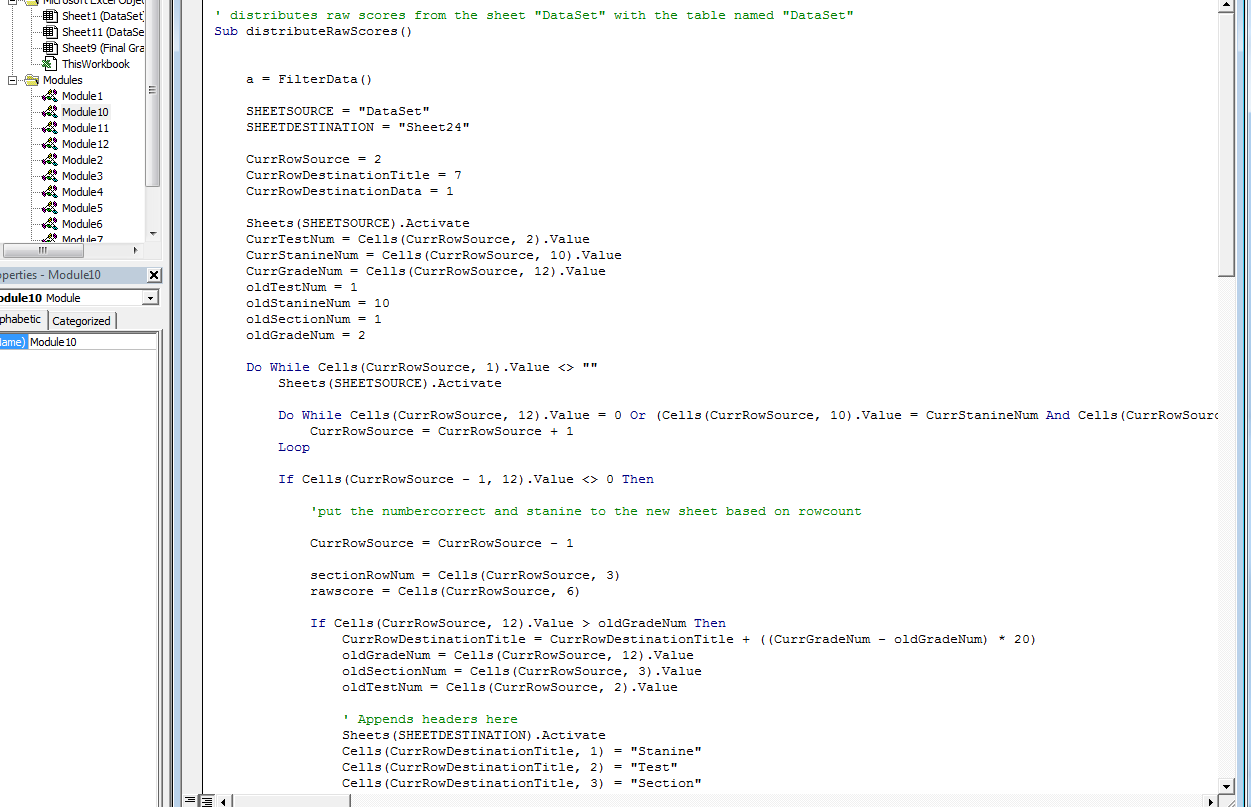
To achieve this, we were able to make a macro in Excel that automatically parses through the data and outputs stanine tables across each section of each test by grade level. Some of these groups have little to no data and is shown by the empty/less filled tables. 2 of the screenshots below show some examples of the stanine tables.

In our last milestone, the stanine tables did not fill out the raw scores yet and were not automated. We had to manually create them. This time, all the stanine charts are automatically outputted for each grade by test and section. (Our client wants it by grade by test and section because that is what they will use in their system to display results to the users. The end goal is for users to have feedback regarding where their test scores from diagnostic tests stand in relation to other people in their grades on each of the tests and sections.)

The end goal of this deliverable is for our client to connect our Excel file into their back-end SQL database to be used in their website. The end goal is to read off the data from the Excel file and feed it into the results page for users taking diagnostic tests in the future.

Michael and Jesse worked together on this milestone. Both of us will work together on the next milestone again.

Screenshots:
Stanine Tables 1

Stanine Tables 2
Note: there are much more stanine tables than can be possibly shown. Grades 3-11 have a stanine table each broken up by test and section (there are 6 tests total and 4 sections for each test).

Macro Code 1

Macro Code 2
Note: this is all the code that deals with actually outputting the stanine tables. The code for setting up the correct filters is not shown.

Thursday, April 10, 2014

Automation of Visualizations (Michael and Jesse)

This milestone we needed to redo some of our work. After meeting with our client, we realized that we needed to understand the data better before we moved forward. Some new visualizations needed to be created to correctly evaluate the data set. That would give a quick and easy way to see the validity and quantity of the data. This milestone makes visualizations based on data that is sorted by test, section and grade.

After talking to our client, we set up a meeting with him and one of his developers who offered to help us. We asked if there was an easy way of creating visualizations that was automated with excel but he didn't know of any methods we didn't already know so we continued to write everything with macros in Excel.

The conclusion we came to is that there is not enough data right now. We then altered the code to exclude grades and only look at test and section to try to do less filtering to get more data per graph. This helped but there should still be a lot more data to be effective. As time goes on and data accumulates, the graphs will be more informative in different ways. One example would be the distribution of scores for a particular test and section.

Jesse and Michael worked equally on the code to get the visualizations to be automated.

Automated Visualizations


Macro for Visualizations

Our goal is to fill in the Stanines